Statistical data about market trends in Industrial Robotics
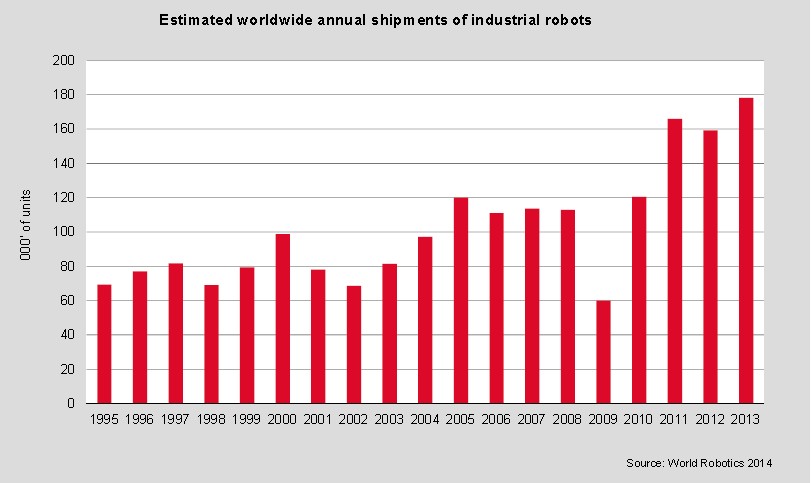
According to a report of the International Federation of Robotics (IFR), in 2013, robot sales increased by 12% to 178,132 units, by far the highest level ever recorded for one year. Sales of industrial robots to the automotive, the chemical, and the rubber and plastics industries, as well as to the food industry continued to increase in 2013. The electrical/electronic industry also increased the number of robot installations in 2013 after the reduction of investments in 2012. China became the biggest robot market with a share of 20% of the total supply in 2013. About 70% of the total robot sales in 2013 were in Japan, China, the United States, Korea and Germany. Between 2008 and 2013 the average robot sales increase was at 9.5% per year (CAGR).
In 2013, about 30,300 industrial robots were shipped to the Americas, 8% more than in 2012, reaching again a new peak level like in 2011 and 2012. Drivers of this growth were the general industry and the automotive parts suppliers, while the motor vehicle industry reduced robot investments in 2013 compared to 2012. Since 2010, the modernization of the North American factories and the increase of production capacities in North America and in Brazil, especially by the automotive industry, accelerated the pace of robot installations substantially in the Americas. Between 2008 and 2013, the compound annual growth rate (CAGR) of robot supplies to the Americas was about 12% on average.
Robot installations in the United States continued to increase, by 6% to the peak of almost 23,700 units. Since 2010, the necessary modernization of the domestic production facilities has been boosting robot shipments to the United States. Between 2010 and 2013, annual sales in the United States increased by 18% on average per year (CAGR). In Canada, robot sales increased by 29% to 2,250 units in 2013. Despite the increasing trend of robot installations since 2010, the volume is still below the peak levels of 2005 and 2007, when about 3,000 robots were installed in each year. Robot sales to Mexico increased by 30% to a new peak level of 2,739 units in 2013. Robot sales to Brazil decreased from the peak level of 1,645 units to 1,398 units in 2013, 15% less than in 2012.
Asia (including Australia and New Zealand) was by far the biggest region with 98,807 industrial robots sold, 17% higher than in 2012. This was by far the highest level ever recorded. Almost all industries increased robot investment in 2013. After the strong increase of 132% in 2010, sales of industrial robots again rose, by 27%, to a new peak of about 88,700 units in 2011 and decreased in 2012 to 84,645 units. Between 2008 and 2013, the compound annual growth rate (CAGR) of robot supplies to Asia/Australia was about 8% on average. With Japan excluded, the CAGR was about 22%.
The People’s Republic of China became the biggest robot market in 2013 regarding annual sales. For the first time ever, the sales figures of Chinese robot suppliers are included in the IFR statistical survey. 36,560 industrial robots were sold in 2013 in China. Thereof, Chinese robot suppliers installed about 9,000 units according to the information from the China Robot Industry Alliance (CRIA). Their sales volume was almost three times higher than in 2012. Foreign robot suppliers increased their sales by 20% in China. Between 2008 and 2013, total supply of industrial robots increased by about 36% per year on average in China. In 2013, robot sales in Japan decreased by 12% to 25,110 units. The automotive industry, the electronics industry and the metal and machinery industry significantly reduced their robot investments in 2013. The business of the electrical/electronics industry was already weak in 2011 and 2012. The automotive industry however made considerable investments in robot installations during the same period (2011-2012).
New production processes and new car models made it necessary to retool the assembly lines. It was also essential to rebuild factories which were destroyed by the tsunami in 2011. Furthermore, the Japanese automotive industry has had the lead in the development and production of electric cars. Robot sales in Japan have been following a decreasing trend since 2005 (which reached the peak at 44,000 robot units). Between 2008 – just before the global financial crisis – and 2013, robot sales in Japan were decreasing by 5% on average per year (CAGR). Robot supplies in the Republic of Korea increased by 10% to about 21,300 units in 2013 compared to 2012. In particular, the automotive parts suppliers increased their robot investments substantially while almost all other industries bought fewer robots in 2013. In 2013, robot sales surged by 62% to almost 5,500 units, a new peak level in Taiwan which became the fourth largest robots market in Asia. Thailand is one of the rapidly growing robot markets in Asia. In 2013, however, the supply of industrial robots declined from the peak level of about 4,000 units to about 3,200 units. Robot supplies to other South/Eastern Asian countries like Indonesia, Malaysia, Singapore and Vietnam increased in 2013. Robot installations in India reached a new peak of about 1,900 units.Those in Turkey continued to increase in 2013 to about 1,100 units, a new peak level.
In 2013, industrial robot sales in Europe reached almost the peak of 2011 (43,800). About 43,300 units were sold 5% more than in 2012. The drivers of the growth in 2013 were the car manufacturers which increased robot installations by 17% to almost 13,800 units, the highest number ever recorded. Robot sales to almost all other industries decreased. After substantial investments of the automotive industry in 2011 robot installations in this sector were somewhat reduced in 2012, while almost all the other industries continued purchasing robots. Between 2008 and 2013 the compound annual growth rate (CAGR) of robot supplies to Europe was about 4.5%.
In 2013, robot sales to Germany – by far the largest robot market in Europe - were 4% higher than in 2012 and reached about 18,300 units, which is the second highest number ever recorded for one year. The motor vehicle suppliers again were the drivers of the growth and increased robot investments while the automotive parts suppliers again reduced their robot installations. All other industries – the general industry - decreased investments in 2013 compared to 2012. Total sales to the general industry have lagged behind expectations since 2009. The robot supply to Germany increased between 2008 and 2013 by about 4% on average per year (CAGR) despite the already existing high robot density. Total sales of industrial robots were up by 7%, to 4,701 units in 2013, from about 4,400 units in 2012 in Italy. The car manufacturers, the metal products industry, and the pharmaceutical industry increased robot installations, while automotive parts suppliers ordered fewer robots. The robot supply in Italy recovered in 2010 and 2011, from 2,900 in 2009 to about 5,100 units in 2011. From 2007 to 2009, robot sales fell from about 5,800 units to 2,900 units. Robot supplies in Italy between 2008 and 2013 were stagnant (compound annual growth rate, CAGR).
In 2013, sales of industrial robots in Spain surged by 38% to almost 2,800 units compared to 2012. This was the result of considerable investments of the car manufacturers as well as of almost all other industries, except the rubber and plastics industry. In 2009, Spain had the lowest shipment level since 1998 due to the worldwide economic and financial crisis. In 2010 and 2011, robot sales recovered to about 3,100 units in 2011. In 2012, the robot supply were again down to about 2,000 units. In 2013, sales of industrial robots in the United Kingdom decreased by 16% to 2,486 units, the second highest number of units ever recorded. In 2012, robot installations reached a peak of 2,943 units in the United Kingdom. Robot installations had already grown substantially in 2011. The automotive industry was the driver of the substantial increase in 2011 and 2012. Even though the robot investments of the car manufacturers decreased in 2013, they were still at the second highest level after 2012. The automotive parts suppliers and the general industry further increased robot orders in 2013. The car manufacturers have been investing in modernisation, increasing capacities, retooling, and new production sites. The continued but moderate recovery of robot sales in France since the economic and financial crisis in 2009 was interrupted in 2013. Robot sales dropped by 27% to about 2,200 units. The robot supply to the automotive industry – the largest user of industrial robots - and almost all other industries decreased considerably in 2013. Robot sales to BENELUX were following an increasing trend since 2010, reaching a new peak level of almost 1,900 units. Sales to Sweden increased to about 1,200 units. Robot sales in most of the Central/Eastern European countries were considerably up, especially in the Czech Republic and in Slovakia

References:
[1] International Federation of Robotics, Executive Summary, World Robotics, 2014.
[2] International Federation of Robotics, Executive Summary, Positive Impact of Industrial Robots on Employment, 2014