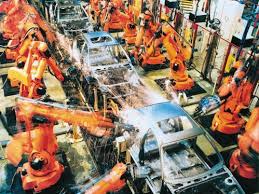
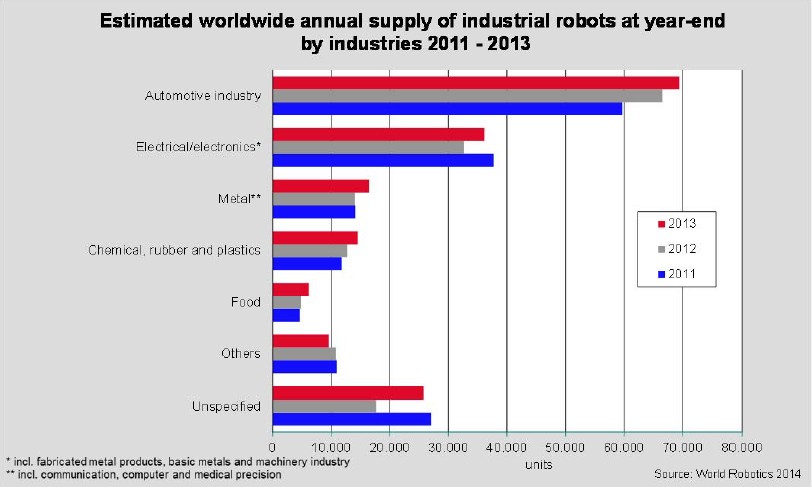
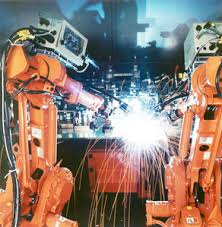
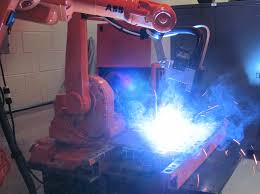
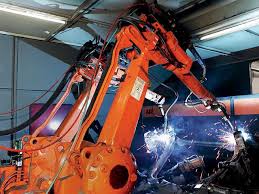
Since 2010, the automotive industry – the most important customer of industrial robots – has considerably increased investments in industrial robots worldwide. About 69,400 new robots, 4% more than in 2012, were installed in this industry in 2013, establishing again a new peak. The share of the total supply was about 39%. Between 2009 – when robot installations hit rock bottom – and 2012, robot sales to the automotive industry surged from 19,300 units to 66,500 units.
With regard to Australia, China, India, Thailand, Taiwan and other Asian countries, the data concerning the distribution of robots according to various industries is not complete. But considering that most of these countries are emerging markets with regard to the automotive industry, the real share of robot supplies to the automotive industry is probably even higher.
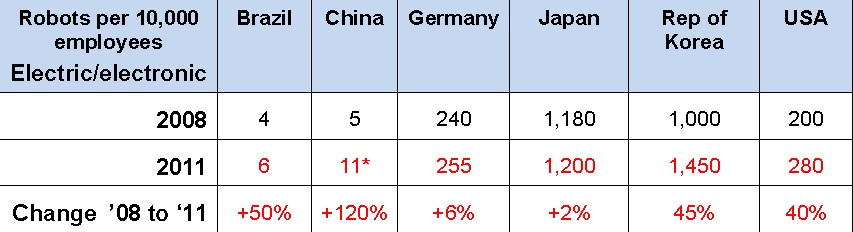
The electrical/electronics industry (including computers and equipment, radio, TV and communication devices and equipment and medical, precision and optical instruments) increased robot orders by 11% to 36,200 units in 2013. This was the second highest level after 2011 (37,750 units).
The share of the total supply in 2013 was about 20%. In 2010, the worldwide shipments of industrial robots almost tripled to about 31,500 units, up from 10,900 units in 2009. Although sales decreased in 2012, the rising demand for electronic products and new products, as well as the need to automate production (particularly in low wage countries), were the driving factors for a higher number of industrial robots in 2013.
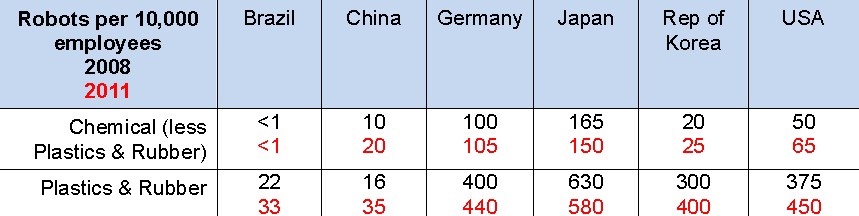
The rubber and plastics industry has continuously increased the number of robot installations since 2009 from about 5,800 units to 12,200 units in 2013. However, this is still far below the peak of almost 15,000 units in 2006 and 2007. Share of the total supply in 2013 was about 7%. Robot sales to the pharmaceutical and cosmetics industry surged by 69% to almost 2,000 units (a new peak). Despite the high degree of automation in this industry, the number of industrial robot installations has remained relatively low for many years. Between 2010 and 2012, sales decreased from almost 1,500 units to almost 1,200 units.
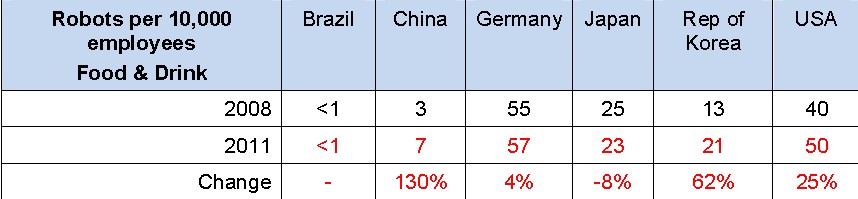
The food and beverage industry increased robot orders by 28% to almost 6,200 units, accounting for a share of 4% of the total supply. Sales have been continuously increasing, except in 2009.
In 2013, sales to the metal and machinery industry reached a new peak level of almost 16,500 units, accounting for a share of 9% of the total supply. In 2009, sales dropped to about 5,300 units. In 2010, sales started to recover considerably, and gained further momentum in 2011. In 2012, the supply more or less stagnated.
The total worldwide stock of operational industrial robots at the end of 2013 was in the range of 1,332,000 and 1,600,000 units. Forecasts show that in the forecoming years the number of industrial robotic installations will further grow. The most significant raise of the number of industrial robotic manipulators used in manufacturing will be in Asia (china and Japan) but there will be also a significant increase in European and North American Countries.
In 2013, the sales value increased by 12% to US$9.5 billion to a new peak. Unit sales also increased by 12%. It should be noted that the figures cited above generally do not include the cost of software, peripherals and systems engineering. Including the mentioned costs might result in the actual robotic systems market value to be about three times as high. The worldwide market value for robot systems in 2013 is therefore estimated to be $29 billion
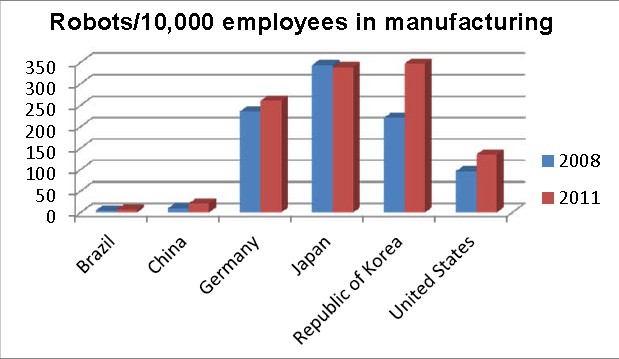
When comparing the distribution of multipurpose industrial robots in various countries, the robot stock, expressed in the total number of units, can sometimes be a misleading measure. In order to take into account the differences in the size of the manufacturing industry in various countries, it is preferable to use a measure of robot density. One such measure of robot density is the number of multipurpose industrial robots per 10,000 persons employed in manufacturing industry or in the automotive industry or in the “general industry” (which is all industries excluding the automotive industry).
In 2013, the Republic of Korea again reached the highest robot density in the world. Per 10,000 employees, 437 industrial robots were in operation. The reason is the continued large volume of robot installations in the recent years. The robot density in Japan decreased to 323 units, and in Germany it continued to increase to 282 units. It is followed by Sweden, which in 2013 had a density of 174 robots per 10,000 employees in the manufacturing industry. The rate has been continuously increasing in the past years. It is followed by Belgium and Denmark with a robot density of 169 and 166 units respectively. The rates increased considerably compared to 2012.
The robot density continuously rose in the United States to 152 units in 2013. Taiwan had a density of 142 units at the end of 2013, up from 124 in 2012. There was a substantial increase of robot installations in 2013. The rate of density in Spain continued to increase to 141 units. France follows with 125 industrial robots in operation per 10,000 employees in the manufacturing industry, Finland with 122 units, Austria with 118 and Canada with 116 units.
In the Netherlands, Slovenia, Slovakia, Switzerland, Australia, the Czech Republic and the United Kingdom, densities ranged between 93 and 66 units. The robot density ranked below the average robot density worldwide (62 units in 2013) in all other surveyed countries.
Many of these countries are emerging robot markets. In 2013, the average robot density in the following regions was: 82 in Europe, 73 in the Americas, and 51 in Asia. The density of robots per 10.000 employees in manufacturing, in countries exhibiting significant industrial production is given in the following table.
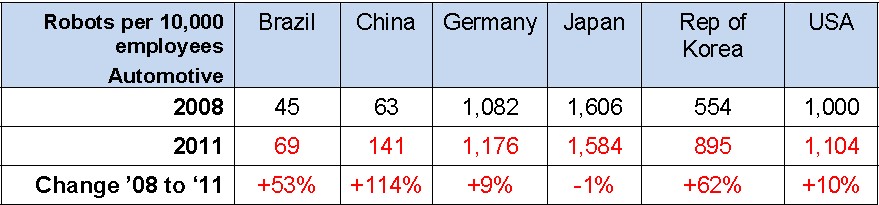
The considerable high rate of automation of the automotive industry compared to all other sectors is demonstrated in the evaluation of the number of industrial robots in operation per 10,000 employees in automotive industry and in all other industries. In 2013, like in previous years, Japan had by far the highest robot density in the automotive industry. 1,520 industrial robots were installed per 10,000 employees in the automotive industry versus 214 robots in all the other industries. In Germany 1,140 robots per 10,000 employees were installed in the automotive industry in 2013. The robot density, the employment rate in the German automotive sector, as well as the operational stock, continuously increased between 2010 and 2013. Furthermore, in all other German industries the robot density continued to increase to 154 units, which is significant compared to the other countries.
Regarding the robot density in the automotive industry, the United States ranked third with a robot density of 1,111 units. It increased only moderately between 2010 and 2013 while the operational stock rose considerably. The reason is the remarkable increase of employment in the automotive industry in the same period. The employment rate in the automotive industry increased by 21% in 2013 compared to 2010. Only 82 units of robots, per 10,000 employees, were installed in all the other sectors.
In China, the huge amount of robot investments in the recent years resulted in a substantial increase in the robot density of the automotive industry. Between 2006 and 2013, the number of installations steadily increased from 51 to 281 robots per 10,000 employees. All other sectors also increased the number of robot installations, but the robot density rate was only about 14 robots per 10,000 employees in 2013. The potential for robot installations in this market is still tremendous
The overall conclusion indicates that in almost all the surveyed countries, the potential for robot installations in the non-automotive industries is still tremendous, but it is also considerably high in the automotive industry among the emerging markets and in some traditional markets as well. This is mostly due to the necessary modernization and retooling that is needed in these markets.R
References:
[1] International Federation of Robotics, Executive Summary, World Robotics, 2014.
[2] International Federation of Robotics, Executive Summary, Positive Impact of Industrial Robots on Employment, 2014